C++ Unwind Exception Metadata: A Hidden Reverse Engineering Bonanza

The worst part of reverse engineering C++ programs -- or really, any program that uses custom structure types with no definitions provided -- is that information about structures is often incomplete, sporadic, and isolated. Consider the following function:

From this code, we can infer that rcx points to a struct that has a QWORD-sized field at offset +0x70. However, from this code alone, we don't know:

  • The true type of the field at offset +0x70;
  • The types and locations of any other fields;
  • How big the struct is;
  • Where else in the program the struct is used;
  • Whether the struct contains any other structs, or is contained in any other structs.

The most precise struct we can infer based upon this evidence is:

struct sub_180013E60_arg_0 {
  char gap0[0x70];
  _QWORD qw70;
};

To obtain more information about the struct, we would need to go on a scavenger hunt looking at the callers of sub_180013E60 and following the pointer around the code to find other accesses. This procedure can easily lead to dead-ends, where the pointer is read from or written to another memory location, and we have no easy way of knowing what other parts of the code access that memory location; or if the function or its callers were declared virtual and hence called indirectly. In short, structure recovery is a tedious process that involves working with incomplete information most of the time, and gradually refining that information by finding other uses of the same structure type.

This blog entry describes an overlooked source of information in C++ programs that can make manual and automated type reconstruction more efficient. More information about the data types used within a function is hiding in plain sight; we can exploit it if we simply know where to look and how to interpret it.

Hex-Rays 9.0 contains built-in support to display this information -- namely, C++ exception wind and unwind metadata on MSVC/x64 targets -- naturally and automatically, directly in the decompilation listing.

Background: C++ Exception Support

Like other programming languages, C++ supports the notion of exceptions. The three relevant language keywords are throw, try, and catch. (Standard C++ does not have a finally keyword.)

Upon encountering an exceptional situation, C++ code can use the throw keyword to raise a new exception. For example, consider the following function:

void may_throw() {
  if ( rand() & 1 )
    throw std::runtime_error("You lose");
}

C++ code uses the try keyword to create a scope in which an exception may occur. try scopes have one or more catch blocks to catch specific types of exceptions. For example:

try {
  may_throw();
  printf("No exception\n");
}
catch ( std::runtime_error &r ) {
  printf("Caught standard runtime_error %s\n", r.what());
}
catch ( std::exception &e ) {
  printf("Caught standard exception %s\n", e.what());
}
catch ( ... ) {
  printf("Caught any exception\n");
}

A catch handler might decide that, despite catching an exception, it is unable to handle it, and that the exception should be passed to the next catch handler (or to the next try block if no remaining catch handler can process it). Using the keyword throw by itself will propagate the exception as such. For example:

try {
  may_throw();
  printf("No exception\n");
}
catch ( std::runtime_error &r ) {
  printf("Can't handle standard runtime_error %s\n", r.what());
  throw; // <- HERE: let the next handler try to process it
}

Hex-Rays 9.0 Support

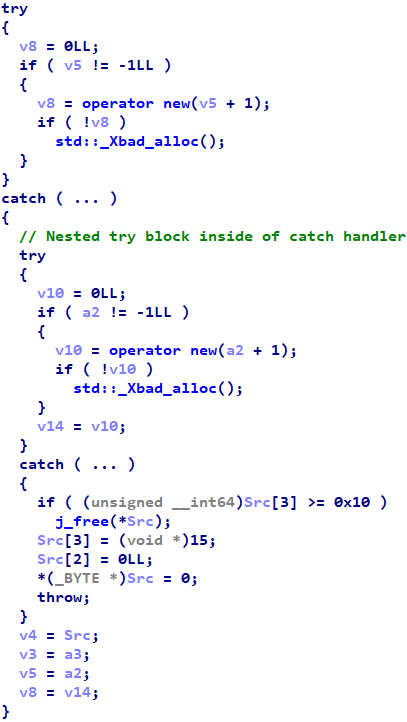
I have spent all of 2024 implementing C++ exception metadata for MSVC/x64 into Hex-Rays 9.0. It is capable of representing try and catch blocks, including nested ones, as such:

Or try blocks with multiple catch handlers:

(Note that early beta "releases" suffered from issues that would often prevent their display; these issues have been remedied in advance of the eventual full release.)

However, this blog entry is about a different kind of C++ exception metadata: namely, wind and unwind. In the remainder of this blog entry, we introduce wind and unwind metadata -- what it is, and when and why the compiler inserts it -- before describing how to exploit it when reverse engineering C++ programs.

C++ Object Model: Destructors

Although C++ exception support encompasses just three language keywords, its implementation is complex and requires substantial runtime support from the compiler and operating system. C++ guru Herb Sutter authored a trilogy of books on the subject, spanning a total of 810 pages! The complexity primarily comes from the interplay between exceptions and two other C++ language features, namely, constructors and destructors.

Leaving exceptions aside for the moment, in the C++ object model, the compiler is obligated to insert calls to object destructors when their lifetimes end. In the context of stack-allocated local variables, this is the end of their enclosing scope. Let's consider a simple struct with a constructor and a destructor:

// Arbitrary type with a constructor and destructor
struct A {
  int val;
  A(int x) : val(x) { printf("A::A(%d)\n",  val); }
  ~A()              { printf("A::~A(%d)\n", val); }
};

And a small function that constructs two of these objects:

void h() {
  A a0(0);
  A a1(1);
}

If we were to execute function h, we would see the following output:

A::A(0)
A::A(1)
A::~A(1)
A::~A(0)

Although the function h does not explicitly destroy its two local objects a0 and a1, we see from the output that their destructors do in fact run at the end of the function. This is because the compiler implicitly inserts those calls at the end of the objects' lifetimes:

void h() {
  A a0(0);
  A a1(1);

  // NEW: Auto-generated destructor calls at lifetime end
  a1.~A();
  a0.~A();
}

Exceptions and Destructors

Building from previous examples, let's investigate what happens when we introduce exceptions into the object model. Like the previous function h, function f below constructs two objects of type A. However, this time, there are three locations within f that might throw an exception, which I have labeled as points -1, 0, and 1:

void f() {
  // Point -1
  may_throw();
  printf("-1: no exn\n");

  // Construct A object a0
  A a0(0);
  // Point 0
  may_throw();
  printf("0: no exn\n");

  // Construct A object a1
  A a1(1);
  // Point 1
  may_throw();
  printf("No exn anywhere %d %d\n", a0.val, a1.val);
  
  // Auto-generated destructor calls at lifetime end
  a1.~A();
  a0.~A();
}

In non-exceptional circumstances, i.e., when the function returns normally, execution will reach the destructor calls at the bottom. If any call to may_throw causes an exception, the function f will not execute any of its remaining code, and will instead exit early and propagate the exception into its caller. That means that, in exceptional circumstances, the destructor calls for local objects a0 and a1 at the bottom of the function will not execute.

At first glance, this might seem like a major problem. If destructor calls were skipped because of exceptions, we should expect resource leaks and other resource management issues (for example, deadlocks upon failure to release thread synchronization primitives). It is very important that the compiler still call the destructors for local objects when exceptions are thrown.

To add additional complexity, depending upon which call to may_throw throws an exception, the compiler has different obligations as to which local objects it must destroy.

  • Point -1: no objects were created, so nothing needs to be (nor should or can be) destroyed.
  • Point 0: a0 must be destroyed, but a1 must not be, since a1 was not constructed at point 0.
  • Point 1: both a1 and a0 must be destroyed.

Despite these complexities, because we added printf statements to A's constructor and destructor, we can see that the compiler nevertheless manages to call the correct destructors:

// OUTPUT: exception thrown at point -1
[no output]

// OUTPUT: exception thrown at point 0
-1: no exn
A::A(0)
A::~A(0)

// OUTPUT: exception thrown at point 1
-1: no exn
A::A(0)
0: no exn
A::A(1)
A::~A(1)
A::~A(0)

// OUTPUT: no exception thrown
-1: no exn
A::A(0)
0: no exn
A::A(1)
No exn anywhere 0 1
A::~A(1)
A::~A(0)

The correct destructor calls execute, despite that execution never reaches the destructor calls at the bottom of the function (which we could confirm by setting breakpoints in a debugger, for example).

Exceptions cause object lifetimes to end prematurely, and exceptional control flow bypasses the destructor calls that the compiler inserts at the end of objects' ordinary, non-exceptional lifetimes. Yet, as we have seen, the compiler also has some mechanism for invoking destructors in the presence of exceptions. What is this mechanism?

Wind states

What actually happens is that the C++ compiler emits special wind/unwind metadata to ensure that the destructors are called. These __wind and __unwind blocks are effectively invisible try and catch blocks that ensure destructors are called in the event of exceptional control flow. Internally, MSVC will transform our example akin to the following:

void f() {
  may_throw();
  printf("-1: no exn\n");

  A a0(0);
  // NEW: wind block for a0
  __wind {
    may_throw();
    printf("0: no exn\n");

    A a1(1);
    // NEW: wind block for a1
    __wind {
      may_throw();
      printf("No exn anywhere %d %d\n", a0.val, a1.val);
    }
    // NEW: unwind handler for a1
    __unwind {
      // Destroy a1 if exception at point 1
      a1.~A();
    }
    a1.~A();
  }
  // NEW: unwind handler for a0
  __unwind {
    // Destroy a0 if exception at point 0 or 1
    a0.~A();
  }
  a0.~A();
}

Perhaps the functionality of these __wind and __unwind blocks would be clearer if we rewrote them with the standard try and catch constructs:

void f() {
  // Point -1
  may_throw();
  printf("-1: no exn\n");

  A a0(0);
  // NEW: try instead of __wind
  try {
    may_throw();
    printf("0: no exn\n");

    A a1(1);
    // NEW: try instead of __wind
    try {
      may_throw();
      printf("No exn anywhere %d %d\n", a0.val, a1.val);
    }
    // NEW: catch instead of __unwind
    catch ( ... ) {
      a1.~A();
      // NEW: Re-throw the exception so the next catch block gets it
      throw;
    }
    a1.~A();
  }
  // NEW: catch instead of __unwind
  catch ( ... ) {
    a0.~A();
    // NEW: Re-throw the exception out of the function
    throw;
  }
  a0.~A();
}

As we see, an __unwind handler is effectively a catch handler that catches any exception, destroys an object, and then throws the exception to the next handler up the chain. The compiler inserts them to guard the lifetimes of local stack objects in case exceptional control flow would skip their ordinary destructor calls.

Thus, we have resolved the mystery of why the compiler is able to destroy locally-allocated objects in spite of exceptional control flow and lack of try/catch blocks: because the invisibly-inserted __wind and __unwind blocks play the roles of try/catch and ensure the proper destructors are called.

Implementation, Very Briefly

This blog entry is not a treatise on how MSVC implements C++ exception machinery on the binary level. However, long-time IDA users are likely familiar with seeing messages about function chunks at the top of functions in the disassembly listing (and seeing those chunks as additional entrypoints in the graph view), as follows:

Not all function chunks come from C++ exception handlers, but in IDA up to the latest version 8.4, C++ catch and __unwind handlers are shown as function chunks such as these. (In IDA 9.0, MSVC x64 C++ catch and __unwind handlers are now defined as standalone functions, so they will no longer be shown as function chunks.)

Exceptions and Constructors

So far, we have seen that MSVC inserts so-called __unwind/__wind metadata to ensure that destructors of locally-held stack objects shall be called when exceptions are thrown. These are not the only circumstances in which such metadata is emitted.

Suppose that the constructor for a struct or class object calls functions that might throw exceptions. This idea may seem unusual, but constructors often allocate memory via calls to operator new, which throws std::bad_alloc upon allocation failure. Therefore, the constructor of any data field that calls operator new would qualify. This is another potentially problematic circumstance: any fields constructed prior would need to be destroyed before the exception were propagated out into the calling function, or else their resources would leak.

To be concrete, consider the following struct:

struct two_lists {
  std::list<int> l0;
  std::list<int> l1;
};

Its automatically-generated constructor body would look like this:

two_lists::two_lists() {
  // Point -1
  this->l0.std::list<int>();
  // Point 0
  this->l1.std::list<int>();
};

Much like the previous examples, if an exception were thrown at point 0, we would have constructed l0, and we would need to destroy it before propagating the exception into the caller. The compiler inserts __wind/__unwind metadata to ensure this happens:

two_lists::two_lists() {
  this->l0.std::list<int>();
  __wind {
    this->l1.std::list<int>();
  }
  // Ensure l0 is deleted if exception while constructing l1
  __unwind {
    this->l0.~std::list<int>();
  }
};

Hex-Rays 9.0 Support

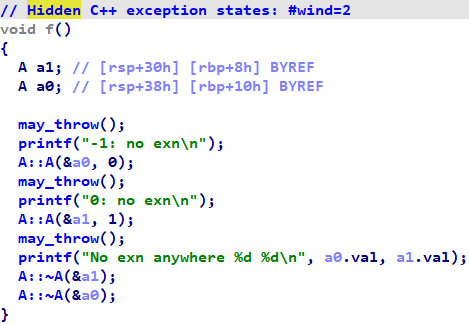
Hex-Rays 9.0 also has support for displaying wind and unwind information (although the default is not to show that metadata, for reasons we will discuss later).

For example, here is the function that we used as a running example when introducing wind constructs:

Note the message at the top informing the user that wind states were present but hidden. If one were to right-click anywhere in the function, they would see the option to show wind states:

Then the wind states would appear in the decompilation:

Reverse Engineering

Now that we have discussed the background, let's talk about when and why wind metadata is useful for reverse engineering. As we shall see, sometimes it is very useful, and sometimes less so.

As we have learned, MSVC emits wind metadata within constructors to ensure cleanup if an exception causes the constructor to terminate early. The wind metadata shows destructors for sub-objects contained within the one being constructed. This is useful because it gives three types of extra information about a struct/class and its members:

  1. Information about the struct/class member types.
  2. Evidence of substructure nesting relationships for contained objects.
  3. Inheritance relationships that would otherwise be hidden.

Field Types

In the introduction, I lamented the "scavenger hunt" nature of structure reconstruction in C++. Namely, we often work with limited information about a struct, and we must follow pointers around to fill in missing details. Locating a constructor for the struct type often provides a lot of information about its overall contents, but nevertheless, important and useful information is often still absent from constructors. Locating a destructor for a struct type can help fill in the missing details, but it is not always easy to find a destructor given a constructor or vice versa. (For example, objects can be allocated anywhere in the program with operator new; to find the corresponding destructor, we would need to find a location where the object were destructed via operator delete.)

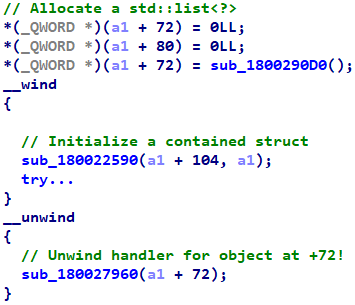
This example comes from the constructor of the top-level class used by ComRAT (for which I previously released a fully reverse engineered IDB). It calls a sub-function to return a pointer, which it writes into offset +72 in the this pointer a1.

Looking into the called function, we see an allocation of 0x30 bytes, where that same pointer is written to offsets +0 and +8 of its own allocation (hallmarks of a doubly-linked list node):

However, we are clearly missing information about this object. The allocation is 0x30 bytes in size, but the previous function only initializes its first 0x10 bytes. What is in the other 0x20 bytes? At present, we can only describe the allocated type with the following incomplete struct:

struct list_node_0x30_unknown {
  list_node_0x30_unknown *_Next;
  list_node_0x30_unknown *_Prev;
  char gap10[0x20]; // HERE: incomplete information
};

To fill in the contents of gap10, we now have to go on a scavenger hunt to find other places this struct field is used -- exactly the type of thing that makes reverse engineering C++ programs so tedious.

But, if we were to enable wind states, we would see that the constructor enters into a wind state immediately afterwards:

Upon looking into the unwind handler, we are immediately presented with accesses to fields within the gap10 region:

The seasoned observer will recognize those extra accesses as a std::wstring, which is 0x20 bytes. So now we can tell more specifically that offset +72 in the main struct holds a std::list<std::wstring>.

This pattern is generally true for C++ STL template containers such as vector, list, map, set, and deque. Their default constructors give limited or no information about the templated element types contained therein: only the element type's size, and in the case of vector, not even that. Conversely, destructors for STL containers call the destructors for the contained elements, thereby giving us more detailed information about the element type. By displaying wind states when analyzing the constructor, we get the best of both worlds!

Structure Nesting

Another task when recovering structs is to determine when fields are contained within nested structs. When the constructors of contained structs are inlined into the outer struct's constructor, this information is blurred. For example, the same constructor function from the last example begins by writing two QWORDs to offsets +0 and +8:

It could be the case that the outer struct contains two fields at offsets +0 and +8. It could also be the case that the outer struct begins with an inner struct at +0 that contains two fields at offsets +0 and +8. Due to inlining, we are unable to differentiate between these two possibilities.

But, the constructor enters into a wind state after initializing those fields. We can see that the this pointer itself, i.e., at offset +0, is passed to the unwind handler. Let's see what's in the unwind handler:

Because of the highlighted access, we know that the type of a1 contains a QWORD-sized field at +8. That means that a1 points to a struct that is at least 16 bytes (and seemingly at most 16 bytes, because there are no accesses beyond the one at +8). We conclude that the first two fields are not members of the outer struct, but rather, are members of a contained struct that begins at offset +0 in the outer one.

This example was simple. wind metadata can also provide rich information about inlined constructors in the presence of multiple nesting levels.

Inheritance Relationships

Yet another task in class recovery is to determine accurate inheritance relationships. One can often determine that two classes are related by looking at which VTables are installed in the constructor and/or destructor. Following cross-references to VTables can help locate related classes.

However, MSVC performs optimizations that can obscure these relationships. For example, if the VTable pointer for a given class is overwritten multiple times in a constructor, the compiler can sometimes eliminate the earlier writes, thereby obscuring the actual base classes for the class being constructed.

This is another situation where wind metadata can provide additional information. Here we see one VTable being written early in the function, and that, upon unwind, a different VTable pointer is written to the same location:

This information would not be present in the decompilation, or even the disassembly listing, were it not for us displaying the wind metadata. And now, we can exploit that information by looking at cross-references to the ancestral VTable, to discover other locations in the code that construct or destruct potentially-related class types:

Non-Constructor Functions

The conclusion of the preceding section is that wind metadata is an unambiguous win when analyzing C++ constructors. wind metadata is a rich source of information that was hiding in plain sight all along. It assists in rapidly analyzing C++ classes, assuming their constructor is known. I recommend enabling it always when you know you are looking at a constructor.

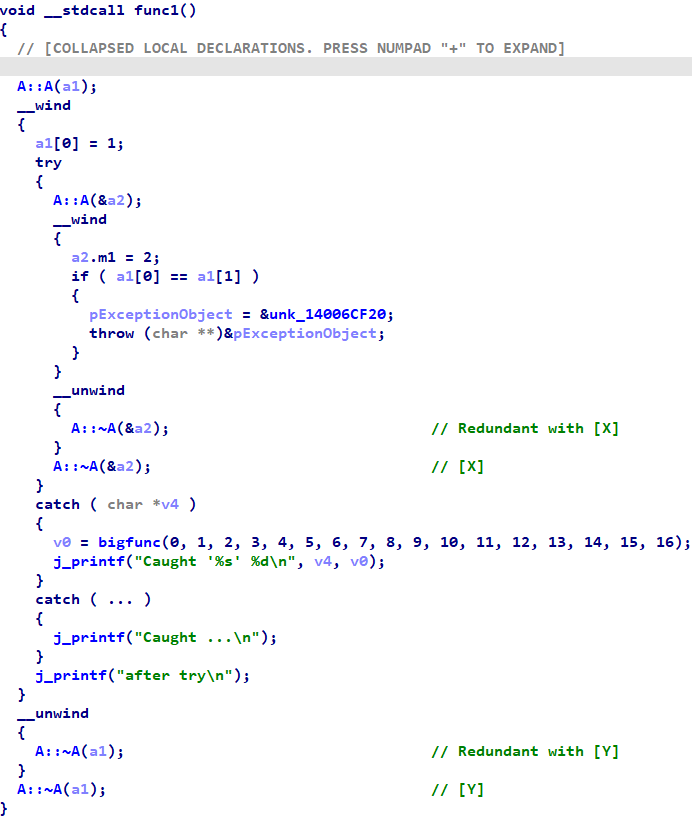
However, this blog entry introduced wind metadata in the context of non-constructor functions. For them, the advantages of displaying wind metadata is mixed. To see this, consider the following function:

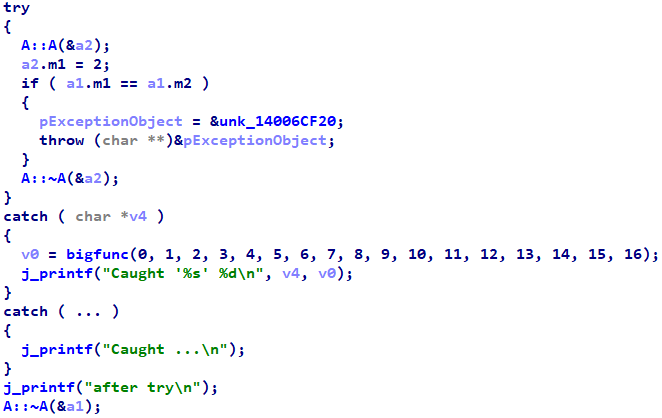
Note that there are two local objects of type A, called a1 and a2. Immediately after creating these objects, the function enters into wind states. Immediately before their lifetimes end, the function exits those wind states. However, because the outer function and the unwind handlers both call the same destructor functions, we do not gain any new information about the types of those objects. All the wind metadata really does for us here is to clarify the lifetime of those objects -- at the expense of 7 extra lines of decompiler output per wind state.

For this reason, the default behavior in Hex-Rays 9.0 is to hide wind states by default, but to inform the user that they exist, and make it easy for them to enable or disable their display.

Those caveats aside, wind metadata can still be useful when analyzing non-constructor functions, because unwind handlers are separate functions that cannot be inlined into the main function. To see this, consider the following function from ComRAT:

In this case, the destructor for a4 has been inlined into the main function (at the bottom of the snippet), but the unwind handler invokes the destructor as a dedicated function call. This is useful because we can apply a name and types to the destructor in the unwind handler. Hex-Rays can use this type to automatically apply a type to a4. Because the destructor in the function body is inlined, even if we as analysts manually recognize the destruction logic, there is nothing for us to apply a type to to cause Hex-Rays to apply type information in other functions. Moreover, because there is an actual function call, we as analysts see a nice, informative function name rather than a messy blob of inlined code. (It also makes the physical struct boundaries and the struct lifetime more clear, which can help recovering local struct types in complex functions with large statck frames.)

An Exhaustively Analyzed IDB for ComLook

This blog entry announces the release of an exhaustive analysis of ComLook, a newly-discovered malware family about which little information has been published. It was recently discovered by ClearSky Cyber Security, and announced in a thread on Twitter. You can find the IDB for the DLL here, in which every function has been analyzed, and every data structure has been recovered.

Like the previous two entries in this series on ComRAT v4 and FlawedGrace, I did this analysis as part of my preparation for an upcoming class on C++ reverse engineering. The analysis took about a one and a half days (done on Friday and Saturday). ComLook is an Outlook plugin that masquerades as Antispam Marisuite v1.7.4 for The Bat!. It is fairly standard as far as remote-access trojans go; it spawns a thread to retrieve messages from a C&C server over IMAP, and processes incoming messages in a loop. Its command vocabulary is limited; it can only read and write files to the victim server, run commands and retrieve the output, and update/retrieve the current configuration (which is saved persistently in the registry). See the IDB for complete details.

(Note that if you are interested in the forthcoming C++ training class, it is nearing completion, and should be available in Q2 2022. More generally, remote public classes (where individual students can sign up) are temporarily suspended; remote private classes (multiple students on behalf of the same organization) are currently available. If you would like to be notified when public classes become available, or when the C++ course is ready, please sign up on our no-spam, very low-volume, course notification mailing list. (Click the button that says "Provide your email to be notified of public course availability".) )

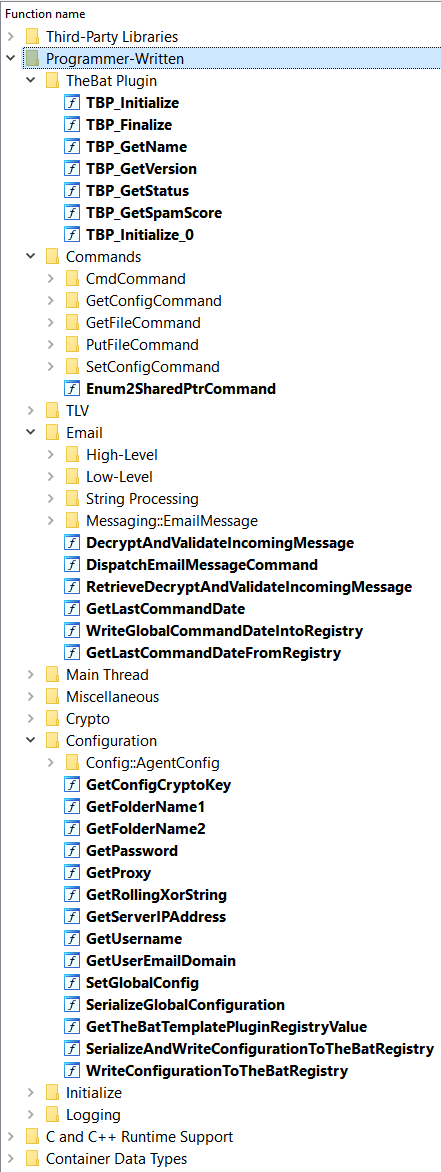
This analysis was performed with IDA Pro 7.7 and Hex-Rays 32-bit. All analysis has been done in Hex-Rays; go there for all the gory details, and don't expect much from the disassembly listing. All of the programmer-created data structures have been recovered and applied to the proper Hex-Rays variables. The functionality has been organized into folders, as in the following screenshot:

The binary was compiled with MSVC 10.0 with RTTI, and uses standard C++ template containers:

  • string/wstring

  • shared_ptr

  • vector

  • list

  • map

The primary difficulty in analyzing this sample was that it was compiled in debug mode. Although this does simplify some parts of the analysis (e.g., error message contain the raw STL typenames), it also slows the speed of comprehension due to a lack of inlining, and includes a huge amount of code to validate so-called C++ debug iterators. This makes locating the real programmer-written functionality more time-consuming. STL functions involving iterators that, in a release build, would have consumed less than a page of decompilation, often consumed five or more pages due to debug iterator validation.

Automation in Reverse Engineering C++ STL/Template Code

There are three major elements to reverse engineering C++ code that uses STL container classes:

  1. Determining in the first place that an STL container is being used, and which category, i.e., std::list<T> vs. std::vector<T> vs. std::set<T>
  2. Determining the element type, i.e., T in the categories above
  3. Creating data types in your reverse engineering tool of choice, and applying those types to the decompilation or disassembly listing.

Though all of those elements are important, this entry focuses on the last one: creating instantiated STL data types, and more specifically, types that can be used in Hex-Rays. The main contribution of this entry is simply its underlying idea, as I have never seen it published anywhere else; the code itself is simple enough, and can be adapted to any reverse engineering framework with a type system that supports user-defined structures.

I have spent the pandemic working on a new training class on C++ reverse engineering; the images and concepts in this blog entry are taken from the class material. The class goes into much more depth than this entry, such as through material on structure and type reconstruction, and by having individual sections on each of the common STL containers.

(If you are interested in the forthcoming C++ training class, it will be completed early next year, and available for in-person delivery when the world is more hospitable. If you would like to be notified when public in-person classes for the C++ course are available, please sign up on our no-spam, very low-volume, course notification mailing list. (Click the button that says "Provide your email to be notified of public course availability".) )

Overview and Motivation

At a language level, C++ templates are one of the most complex features of any mainstream programming language. Their introduction in the first place -- as opposed to a restricted, less-powerful version -- was arguably a bad mistake. They are vastly overcomplicated, and in earlier revisions, advanced usage was relegated to true C++ experts. Over time, their complexity has infested other elements of the language, such as forming the basis for the C++11 auto keyword. However, the basic, original ideas behind C++ templates were inconspicuous enough, and are easy to explain to neophytes. Moreover, reverse engineers do not need to understand the full complexity of C++ templates for day-to-day work.

Let's begin with a high-level overview of which problems in C software development that C++ templates endeavored to solve, and roughly how they solved them. Put simply, many features of C++ were designed to alleviate situations where common practice in C was to copy and paste existing code and tweak it slightly. In particular, templates alleviate issues with re-using code for different underlying data types.

C does offer one alternative to copy-and-paste in this regard -- the macro preprocessor -- though it is a poor, cumbersome, and limited solution. Let's walk through a small real-world example. Suppose we had code to shuffle the contents of a char array, and we wanted to re-use it to shuffle int arrays.

We could simply search and replace char for int this code, and also rename both functions (to, e.g., swap_int and shuffle_int). However, this is a poor solution; it would be nice if there was a language mechanism to do this automatically. Over time, C programmers came to use the macro preprocessor for problems like this. The following two-phase animated GIF shows the first step: wrapping the existing code in a macro declaration.

Next, we want to replace the elements that we wish to alter with macro parameters. In the following two-phase animation, we begin by replacing char with the macro parameter TYPE:

Finally, we use the token-pasting operator ## to rename the functions:

Now, the process of converting the code to a macro is complete. We can do the same for the function declaration:

And then put both the source and header macros into a single header file:

Now, we can use this header to create shuffle instantiations for any type we choose. For each desired type, simply include the header file from above and instatiate the macros:

Then, the following three-phase animated GIF shows how the C preprocessor expands the macros for any given instantiation:

A real-world example can be seen in the uthash library.

The C++ template solution looks very similar to the C macro solution:

ShuffleTemplate.png

The differences are that:

  1. TYPE becomes a template typename parameter.
  2. We don't need the line continuation characters (i.e., \).
  3. We don't need to rename the function.

The same concept really shines in the area of generic data structures. For example, here is the difference between a hypothetical List data structure as a C macro and as a C++ template. (Note that this definition of List is unrelated to the official C++ std::list, mentioned below.)

C++ Template Containers

The C++ standard template library (STL) contains high-quality, generic implementations of common data structures. They are one of the best features of C++, and are used extensively by C++ programmers in real code. As hinted in the example above, they allow C++ programmers to immediately create instances with any types they choose.

One of the most popular STL data structures is known as std::vector. Vectors are like a better version of C arrays:

  • Like arrays, std::vector offers fast lookups using the same syntax (i.e. arr[idx] vs. vec[idx]).
  • Unlike arrays, std::vector knows the number of elements contained within the array (i.e. vec.size()).
  • Unlike arrays, std::vector can grow and shrink dynamically, without requiring the programmer to manually manage the memory (i.e. vec.push_back("hi") and vec.pop_back()).
  • Unlike arrays, std::vector offer bounds-checked indexing -- an imporant step for mitigating C's memory safety issues. I.e., vec.at(500) will throw an exception if vec.size() < 500, whereas arr[500] and vec[500] will not.
  • Programmers can obtain a pointer to the underlying array for compatibility with existing code that requires such pointers. Starting from C++11, this can be accomplished via vec.data().
  • Unlike arrays, std::vector can own the elements it contains, such that deleting the vector will delete those elements. This simplifies resource management.

MSVC's implementation of std::vector is rather simple; when stripped to its core, it simply contains three pointers:

(Before proceeding, it is important to note that the C++ standard specifies the class interfaces for these data structures, but not their internals. Different implementations of the STL -- such as the ones used by MSVC, and by GCC -- implement these container classes differently. Any concrete examples below come from MSVC; the data structures can and will differ for other STL implementations, but the idea in this blog entry can be adapted to any of them.)

These pointers locate the base of the allocation, the last used element, and the last allocated element, as in the following image:

Upon instantiating std::vector<T> with a concrete type for T, the C++ compiler will create a new class layout using the proper T pointers. For example, here we can see two different instantiations for int and string:

Reverse Engineering STL Template Containers

When reverse engineering code that makes use of std::vector<T>, after discovering that a std::vector<T> is indeed in use, the next step is to discover which type was used for T. This comes down to standard structure recovery, and will not be covered in this blog entry. However, my upcoming C++ reverse engineering class will cover these steps in depth. Let's imagine that the reverse engineer discovers they are dealing with a std::vector<int>.

The next step is for the reverse engineer to recreate a data structure compatible with std::vector<int>, and to apply those types to the decompilation or disassembly listing. The reverse engineer could simply create a type like this:

And then apply it to the decompilation. The code might look like this, before (left) and after (right):

Although creating a compatible std::vector facsimilie is not very difficult, creating these structures can be tedious work. For example, my ComRAT IDB contains std::vector<T> instantiations for 16 different types T. Moreover, other STL containers are more complex; for example, std::map actually consists of 5 different, related structures.

The primary contribution of this blog entry is to simply inform the reader that they can create these structures programmatically. In IDA and Hex-Rays, this is as simple as using format strings and an API named parse_decls.

One simply calls this function like MakeVectorType("int"), and one is greeted with a new type named vector_int in the local types window. For more complex scenarios where the type cannot be used in the struct name (for example, int* would lead to a struct with the invalid name vector_int*), the second, optional parameter can be used to create the name of the struct. I.e., MakeVectorType("int*","pInt") would create a struct named vector_pInt whose pointer types were int **.

And... that's more or less it! I have collected the common STL data types into the linked script, such that once the reverse engineer has figured out which types are being used, they can immediately create the structures with no effort on their part. Those types are:

  • std::vector
  • std::list
  • std::map and std::set
  • std::deque
  • std::shared_ptr

For one small added benefit, my script also knows the function prototypes for some common STL container class member functions. The reverse engineer can simply copy and paste these into the function prototype type declaration to immediately set a valid type for these member functions.

These same ideas can be adapted to other STL implementations, as well as custom template libraries. For example, Valve uses their own STL-esque template library; a few minutes worth of work can be used to produce a script comparable to the above.

Not so bad, is it? Reverse engineering C++ template code does not have to be difficult.

Hex-Rays, GetProcAddress, and Malware Analysis

This entry is about how to make the best use of IDA and Hex-Rays with regards to a common scenario in malware analysis, namely, dynamic lookup of APIs via GetProcAddress (and/or import resolution via hash). I have been tempted to write this blog entry several times; in fact, I uploaded the original code for this entry exactly one year ago today. The problem that the script solves is simple: given the name of an API function, retrieve the proper type signature from IDA's type libraries. This makes it easier for the analyst to apply the proper types to the decompilation, which massively aid in readability and presentability. No more manually looking up and copying/pasting API type definitions, or ignoring the problem due to its tedious solution; just get the information directly from the IDA SDK. Here is a link to the script. EDIT LATER: I decided to write a small GUI for the functionality. You can find the Hex-Rays GUI plugin here.

Background

Hex-Rays v7.4 introduced special handling for GetProcAddress. We can see the difference -- several of them, actually -- in the following two screenshots. The first comes from Hex-Rays 7.1:

HR71.png

The second comes from Hex-Rays 7.6:

HR76.png

Several new features are evident in the screenshots -- more aggressive variable mapping eliminating the first two lines, and automatic variable renaming changing the names of variables -- but the one this entry focuses on has to do with the type assigned to the return value of GetProcAddress. Hex-Rays v7.4+ draw upon IDA's type libraries to automatically resolve the name of the procedure to its proper function pointer type signature, and set the return type of GetProcAddress to that type.

This change is evident in the screenshots above: for 7.1, the variable is named v7, its type is the generic FARPROC, and the final line shows a nasty cast on the function call. For 7.6, the variable is named IsWow64Process, its type is BOOL (__stdcall *)(HANDLE, PBOOL) (the proper type signature for the IsWow64Process API), and the final line shows no cast. Beyond the casts, we can also see that applying the type signature also changes the types of other local variables: v5 in the first has the generic type int, whereas v5 has the proper type BOOL in the second.

These screenshots clearly demonstrate that IDA is capable of resolving an API name to its proper type signature, the desirable effects of applying the proper type signature on readability, and the secondary effects of setting the types of other variables involved in calling those APIs.

Relevance to Malware Analysis

Hex-Rays' built-in functionality won't work directly when malware looks up API names by hash, or uses encrypted strings for the API names: the decompiler must see a fixed string being passed to GetProcAddress to do its magic. Although the malware analysis community seems very comfortable in dealing with imports via hash and encrypted strings, they seem less comfortable with applying proper type signatures to the resultant variables and structure members. Only one publication I'm aware of bothers to tackle this, and it relies upon manual effort to retrieve the type definitions and create typedefs for them. This is unfortunate, as applying said types dramatically cleans up the decompilation output, but this is understandable, as the manual effort involved is rather cumbersome.

As a result, most publications that encounter this problem feature screenshots like this one. Note all of the casts on the function pointer invocations, and the so-called "partial types" _QWORD, etc.:

(I chose not to link the analysis from which the above screenshot was lifted, because my goal here is positive assistance to the malware analysis community, and not to draw negative attention to anyone's work in particular. This pattern is extremely frequent throughout presentations of malware analysis; it is immaterial who authored the screenshot above, and I had other examples to choose from.)

The Solution

I did not know how to resolve an API name to its type signature, so I simply reverse engineered how Hex-Rays implements the functionality mentioned at the top of this entry. The result is a function PrintTypeSignature(apiName) you can use in your scripts and day-to-day work that does what its name implies: retrieves and prints the type signature for an API specified by name.

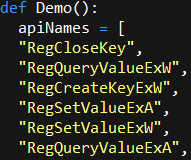
The script includes a demo function Demo() that resolves a number of API type signatures and prints them to the console. It begins by declaring a list of strings:

PyDemo.png

The output of the script is the type signatures, ready to be copied and pasted into the variable type window and/or a structure declaration.

GUI

I decided to add a small GUI to the functionality. After you run this plugin, you will have a new entry on your Hex-Rays right-click menu that appears when your cursor is over a pointer-sized local variable, as follows:

GUIMenu.png

Once you click on that, it will ask you to enter an API name:

GUIAsk.png

If there are no errors, the script will change the type of the variable to the function prototype for the API.

GUIResult.png

A Final Note

Architecturally, there is a discrepancy between how the Hex-Rays microcode machinery handles type information for direct calls versus indirect ones. To summarize, you may still see casts in the output after applying the proper type signature to a variable or structure member. If this happens, right-click on the indirect call and press Force call type to force the proper type information to be applied at the call site. However, only do this once you have set the proper type information for the function pointer variable or structure member.

Mostly I published this because I want to see more types applied, and fewer casts, in the malware analysis publications that I read. Please, use my script!

Addendum

After publishing this article, I was made aware of prior work that is strongly related. That work focuses on the same problem, albeit in the disassembly listing rather than in Hex-Rays (and hence does not discuss some of the considerations from my entry above). Its ultimate solution is very similar to mine; it includes two out of three API calls from the one I came up with in this entry.

What is a while(2) loop in Hex-Rays?

Hex-Rays uses while(1) to represent infinite loops in the output. However, sometimes you might see while(2) loops in the output instead, as in the following:

while2.png

Logically, while(2) behaves the same as while(1) -- both loops are infinite -- but I wondered where they came from, what they meant, and why Hex-Rays produces them. Given that somebody asked me about it on Twitter, it's clear that I'm not the only one who's had this question. I recently learned the answer, so I decided to document it for posterity.

Answering this question requires some discussion of Hex-Rays internals. The decompiler operates in two major phases, known internally as "microcode" and "ctree". The microcode phase covers the core decompilation logic, such as: translating the assembly instructions into an intermediate representation; applying compiler-esque transformations such as data flow analysis, constant propagation, forward substitution, dead store elimination, and so on; analyzing function calls; and more. To learn more, I'd recommend reading Ilfak's blog entry and installing the Lucid microcode explorer.

The ctree analysis phases, on the other hand, are more focused on the listing that gets presented to the user. The ctree phase contains relatively little code that resembles standard compiler optimizations -- some pattern transformations are close -- whereas much of the code in the microcode phase resembles standard compiler analysis. The major differences between the two are that the microcode does not have high-level control flow structures such as loops (it uses goto statements and assembly-like conditional branches instead), and that type information plays a relatively minor role in the microcode phase, whereas it plays a major role in the ctree phase.

Between the microcode and ctree phases, there is a brief phase known internally as hxe_structural, which performs so-called "structural analysis". This phase operates on the final microcode, after all analysis and transformation, but before the ctree has been constructed. Its role is to determine which high-level control flow structures should be presented to the user in the ctree listing. I.e., the information generated by this phase is used during ctree generation to create if, if/else, while, do/while, switch, and goto statements.

After ctree generation is complete, Hex-Rays applies two sets of transformations (known internally as CMAT_TRANS1 and CMAT_TRANS2) to the decompilation listing, to clean up common patterns of suboptimal output. For example, given the following code:

if(cond) {
  result = 1;
  goto label_X;
}
// ...
label_X:
return result;

Hex-Rays will convert this into simply if(cond) return 1;. These phases might also transform while loops into for loops, rewrite while loops as do-while loops or vice versa, convert while(1) { if(cond) break; /* ... */ } to while(!cond) { /*...*/ }, and so on.

There is one transformation in the CMAT_TRANS2 phase that is capable of creating a loop where none previously existed. Namely, it looks for patterns of instructions like the following:

label_X:
/* ... */
goto label_X;

Importantly, the label and the goto must be in the same scope (i.e. inside of the same set of curly braces { }). If this pattern matches -- and the code inside satisfies a few technical restrictions -- Hex-Rays will create a while(2) { /* ... */ }.

while(2) loops are created at CMAT_TRANS2, whereas the other loop transformations mentioned previously take place at CMAT_TRANS1. Therefore, while(2) loops will not be rewritten as a while loop with a conditional, or a do/while loop, or a for loop. If Hex-Rays creates a while(2) loop internally, there will always be a while(2) loop in the final output.

So the short answer to the question is: it doesn't matter what a while(2) loop is. When you see one, you have no reason to think of it any differently from a while(1) loop. Hex-Rays is not trying to communicate anything special to you as a user. while(2) loops are introduced to improve the decompilation listing for common patterns that the structuring algorithms are unable to recognize, for whatever reason. (This is a common pattern in compiler design -- having a set of rewrite rules that can clean up suboptimal results of previous phases. For example, peephole optimizers in compilers operate on a similar principle.)

An Exhaustively-Analyzed IDB for FlawedGrace

This blog entry announces the release of an exhaustive analysis of FlawedGrace. You can find the IDB for the main executable, and for the 64-bit password stealer module, here. The sha1sum for the main executable is 9bb72ae1dc6c49806064992e0850dc8cb02571ed, and the md5sum is bc91e2c139369a1ae219a11cbd9a243b.

Like the previous entry in this series on ComRAT v4, I did this analysis as part of my preparation for an upcoming class on C++ reverse engineering. The analysis took about a month, and made me enamored with FlawedGrace's architecture. I have personally never analyzed (nor read the source for) a program with such a sophisticated networking component. Were I ever to need a high-performance, robust, and flexible networking infrastructure, I'd probably find myself cribbing from FlawedGrace. This family is also notable for its custom, complex virtual filesystem used for configuration management and C2 communications. I would like to eventually write a treatise about all of the C++ malware family analyses that I performing during my research for the class, but that endeavor was distracting me from work on my course, and hence will have to wait.

(Note that if you are interested in the forthcoming C++ training class, it probably will be available in Q3/Q4 2021. More generally, remote public classes (where individual students can sign up) are temporarily suspended; remote private classes (multiple students on behalf of the same organization) are currently available. If you would like to be notified when public classes become available, or when the C++ course is ready, please sign up on our no-spam, very low-volume, course notification mailing list. (Click the button that says "Provide your email to be notified of public course availability".) )

(Note that I am looking for a fifth and final family (beyond ComRAT, FlawedGrace, XAgent, and Kelihos) to round out my analysis of C++ malware families. If you have suggestions -- and samples, or hashes I can download through Hybrid-Analysis -- please send me an email at rolf@ my domain.)

About the IDB

Here are some screenshots. First, a comparison of the unanalyzed executable versus the analyzed one:

AnalysisComparison.png

Next, IDA's function folders should make it easy to find the parts that interest you:

Functions.png

Finally, the local types window contains all of the reconstructed data structures:

LocalTypes.png

About the Analysis

Like the previous analysis of ComRAT v4, this analysis was conducted purely statically. Like the previous, I have reverse engineered every function in the binary that is not part of the C++ standard library, and some of those that are. Like the previous, all analysis was conducted in Hex-Rays, so you will not find anything particularly interesting in the plain disassembly listing. Unlike the previous, this binary had RTTI, meaning that I was given the names and inheritance relationships of classes with virtual functions.

Each C++ program that I devote significant time to analyzing seems to present me with unique challenges. With ComRAT, those were scale and usage of modern additions to the STL that had been previously unfamiliar to me. With XAgent, it was forcing myself to muddle through the subtleties of how MSVC implements multiple inheritance. For FlawedGrace, those challenges were:

  • Extensive use of virtual functions and inheritance, beyond anything I've analyzed previously. Tracing the flow of data from point A to point B often involved around a dozen different object types and virtual function calls, sometimes more. You can see an example of this in the database notepad, where I describe the RDP tunneling implementation.

  • A type reconstruction burden that seemed to never end. FlawedGrace has one of the highest ratios of custom types to program size of anything I've analyzed. In total, I manually reconstructed 178 custom data types across 454 programmer-written functions, which you will find in the Local Types window.

  • Having to reverse engineer a complex virtual file system statically, with no sample data. You can find the relevant code in the functions window, under the folder path Modalities\Standalone\Virtual File System. I suspect this was written by a different team than the networking component, given the difference in coding styles: i.e., the VFS was written in plain C, with some features that mimic VTables.

  • Having to confront, as a user, the challenges that reverse engineering tools have with x86/Windows programs (in contrast to x64) with regards to stack pointer analysis and 64-bit integers.

  • Having to brush up on my network programming skills. For example, I had forgotten what the “Nagle algorithm” was. It’s clear that the server-side component is derived from the same codebase. However, the server portion of the code was not present in the binary, so I could not analyze it.

FlawedGrace makes proficient use of C++ features and the STL, and its authors are experts in concurrent programming and networking. However, it is mostly written in an older style than ComRAT was; for example, it does not use <memory>. Here is a list of the STL data types used, in descending frequency of usage:

  • <atomic>

  • thread

  • list<T>

  • map<K,V>

  • deque<T>

  • set<T>

  • vector<T>

I hope you enjoy the IDB.

An Exhaustively-Analyzed IDB for ComRAT v4

This blog entry announces the release of an exhaustive analysis of ComRAT v4. You can find the IDBs here.

More specifically, an IDB for the sample with hash 0139818441431C72A1935E7F740A1CC458A63452, which was mentioned in the ESET report (see especially its attached PDF), and which is available online on Hybrid Analysis. All of the analysis has been performed in Hex-Rays 64-bit, so the results will be less interesting to IDA users who do not own Hex-Rays 64-bit. That is to say, if you open the IDB, you should definitely use Hex-Rays to view the function decompilations, as that is where all of the naming and commenting has taken place. It is rich with detail, in comparison to the disassembly listing's barrenness.

This analysis took roughly six weeks of full-time work. I have spent the pandemic working on a new training class on C++ reverse engineering; part of the preparation includes large-scale analysis of C++ programs. As such, ESET's report of ComRAT's use of C++ caught my eye. ComRAT has a beautiful architecture, and many sophisticated components, all of which I believe deserve a detailed report unto themselves. I had begun writing such a report, but decided that it was side-tracking me from my ultimate goals with my new training class. Hence, I had decided to wait until the class was ready, and release a collection of reports on the software architectures of C++ malware families (perhaps as a book) after I was done. Thus, my write-up on ComRAT's architecture will have to wait. You can consider this release, instead, as a supplement to the ESET report.

(Note that if you are interested in the forthcoming C++ training class, it probably will not be available for roughly another year. More generally, remote public classes (where individual students can sign up) are temporarily suspended; remote private classes (multiple students on behalf of the same organization) are currently available. If you would like to be notified when public classes become available, or when the C++ course is ready, please sign up on our no-spam, very low-volume, course notification mailing list. (Click the button that says "Provide your email to be notified of public course availability".) )

(Note also that I have more analyses like this waiting to be released. FlawedGrace and XAgent are ready; Kelihos is in progress. If you can provide me with a bundle of Careto SGH samples, preferably Windows 64-bit, please get in touch.)

About the Analysis

This analysis was conducted purely statically, without access to RTTI, or any other form of debug information. The only external information I had was the ESET report. I have reverse engineered every function in the binary that is not part of the C++ standard library, and some of those that are. To get an idea of what the sample looks like before and after analysis, here's a screenshot of the binary freshly loaded into IDA on the left, versus the analyzed one on the right. See if you can spot the difference:

Although I believe that the IDB could probably be loaded in versions of IDA prior to 7.5, I nevertheless recommend using IDA 7.5 to view it. The reason for that is because I have made extensive use of 7.5's new "folders" feature to organize the functions and local types windows, which I found massively useful for large-scale reverse engineering. Those two windows have a nearly identical organization; if you were to dock the windows side-by-side, you would see something like this:

As a result of this analysis, I wrote many Hex-Rays plugins, and devised a number of techniques in C++ reverse engineering that were new to me. Eventually, I will publish on topics such as the following:

  • A Hex-Rays plugin for navigating virtual function cross-references

  • Reverse engineering STL containers, the easy way

  • A Hex-Rays plugin for virtual inheritance

  • Tips for reverse engineering multiple inheritance

  • Automated creation of VTable structure types

  • Automation for detecting inlined functions, and the addition of stock comments

ComRAT uses a lot of C++ features; a mostly complete list follows. If you're interested in learning how to reverse engineer C++ programs, you might do well to study how I analyzed the parts of the binary that interact with them.

  • Inheritance

  • Polymorphism (virtual functions)

  • Custom templates

  • Multiple and virtual inheritance (due to iostreams)

  • STL, listed in descending order of usage frequency:

    • shared_ptr<T>

    • vector<T>

    • string

    • wstring

    • locale

    • unique_ptr<T>

    • wstringstream

    • stringstream

    • fstream

    • list<T>

    • map<K,V>

    • regex

    • wstring_convert

    • random

Notes on the Sample

  1. Although the use of Gmail as a covert channel was a major aspect of the ESET report, I could not get my hands on any samples that had that feature. However, this sample does contain some of the Gmail communication code -- the Gumbo library is compiled into it, and the configuration in the virtual file system contains a "mail" subdirectory, with similar entries to those in the ESET report. Perhaps that feature was still in development, or was deliberately not compiled into my sample for whatever reason.

  2. One striking feature of the ESET report was that their sample had RTTI information compiled into it, which provided the names of many of the classes used within ComRAT. I.e., section 4.3 of the ESET report mentions specific class names, as created by the ComRAT programmers. However, my sample had no such RTTI information. Therefore, all of my analysis had to be done from scratch. I used the few names provided in the report as a guide when creating my own.

  3. To the extent I was able to verify their claims, everything in the ESET report is accurate. There are a few minor technical details in my sample that were different, but are barely worth mentioning, and might have legitimately changed between the creation of my sample and the non-public one they analyzed.

A Compiler Optimization involving Speculative Execution of Function Pointers

Today I discovered a neat optimization that I'd only heard about in graduate school, but had never seen in a real binary. Although the code below involves virtual functions in C++, the same technique would work for ordinary function pointers in C. A few other optimizations are referenced in the explanation below; all of them can be found in my presentation, "Compiler Optimizations for Reverse Engineers", which is the course sample for one of my reverse engineering training classes.

The optimization has to do with increasing speculative execution performance for function pointers that nearly always target one particular destination. Note that this is in contrast to the compiler optimization known as "devirtualization", which is when a compiler can prove that a particular function pointer invocation must always target one particular location, and turns the indirect call into a direct one. The optimization described in this entry differs in that the function pointer might nearly always point to one location, but might occasionally point elsewhere. (These estimates of runtime behavior could be derived through profiling, for example.)

The following is a snippet of code that comes from Microsoft's Active Template Library (ATL). More specifically, the smart pointer known as CComPtr, held in atlcomcli.h. Here is the code; modest, and unassuming:

template <class T>
class CComPtr
{
    T* p;

    // Release the interface and set to NULL
    void Release() throw()
    {
        T* pTemp = p;
        if (pTemp)
        {
            p = NULL;
            pTemp->Release();
        }
    }
}

Being a template class library, the programmer is free to create their own classes based on CComPtr by specifying any class type for the template typename parameter T. Or rather, any class type that has a method named "Release" with signature "void Release()", as that function is invoked by the if-body in the code above. In this scenario, Release is a virtual function — that is to say, objects of type T contain a function pointer pointing to the implementation of a function called “void Release()”.

In the code below, T is specialized by (i.e., replaced with) a scary-looking ATL type name called ATL::CComObject<CSpThreadControl>. So in particular, here is the compiled version of CComPtr<ATL::CComObject<CSpThreadControl>>::Release, whose generic C++ code was shown above.

The first four lines aren't interesting:

.text:18005121B   mov   rcx, [rcx]         ; T* pTemp = p;
.text:18005121E   test  rcx, rcx           ; if (pTemp) {
.text:180051221   jz    short return       ; [if not taken, return]
.text:180051223   and   qword ptr [rax], 0 ;     p = NULL;

The final line, the call to pTemp->Release, has a longer compiled body than one might expect. A line-by-line explanation follows below.

.text:180051227   lea   rdx, offset ATL::CComObject<CSpThreadControl>::Release
.text:18005122E   mov   rax, [rcx]
.text:180051231   mov   rax, [rax+10h] ; rax now contains the pTemp->Release pointer
.text:180051235   cmp   rax, rdx       ; did rax match the fixed location in rdx above?
.text:180051238   jnz   short no_match
.text:18005123A   call  ATL::CComObject<CSpThreadControl>::Release
.text:18005123F
.text:18005123F return:
.text:18005123F   add   rsp, 28h
.text:180051243   retn
.text:180051244
.text:180051244 no_match:
.text:180051244   add   rsp, 28h
.text:180051248   jmp   rax

To explain the code above:

  • Line #-27: move the offset some specific function into rdx.

  • Line #-2E through -31: rax now contains the pTemp->Release function pointer.

  • Line #-35 through -38: Compare rax and rdx. If equal, don't take the jump.

  • Line #-3A through -43: Invoke ATL::CComObject<CSpThreadControl>::Release(pTemp). The important thing to notice is that the function being called is the same one whose offset was moved into rdx on the first line.

  • Line #-44 through -48: If rax had not been equal to rdx, call the function pointer in rax. (More precisely, jump there after destroying the stack frame, as the result of an optimization known as tail call elimination.)

Reflecting on the code above, it might seem weird that it:

  1. Compares a function pointer to the address of a known function, let’s call it X.

  2. Calls the known function X directly if it matches.

  3. Calls the function pointer if it doesn't.

In other words, If the function pointer does match X — regardless of the comparison and direct call — then X would be the function invoked anyway by part #3. The indirect call in part #3 is sufficient; parts #1 and #2 would seem to be superfluous. Moreover, we can clearly see that this behavior was not present in the original C++ code: it was introduced by the compiler. Therefore, why would Microsoft Visual C++ — an otherwise heavily-optimizing compiler — insert the comparison and direct call?

What's happening here is that indirect calls are worse for the processor's speculative execution, since the processor needs to know where the call is going before it can start executing it. Direct calls have better performance, because their destinations are fixed and known. Technically, the virtual function call to Release() could go anywhere -- it is a function pointer, after all. However, because the template is specialized for the type T = ATL::CComObject<CSpThreadControl>, it's reasonable to expect that the virtual function will actually point at &ATL::CComObject<CSpThreadControl>::Release. In fact, profiling might determine that this is the destination on all, or nearly all, of the profiling data. So by performing an explicit comparison, we allow the processor's speculative execution to begin executing the probable destination before the real, runtime destination is known. As a result, if the virtual function usually points where we expect, we’ll get better speculative execution success, and hence better performance.

There's another neat aspect to the code above, also involving speculative execution. Notice that the jump after the comparison on lines #-35 through -38 is in the forward direction. The Pentium 4+ static branch prediction algorithm assumes that jumps that go in the forward direction won't be taken. Therefore, the compiler arranges the indirect function call to be at the end of a forward branch, which encourages the processor to speculatively execute the direct call target on the not-taken side instead of down the path with the indirect call.

Automation Techniques in C++ Reverse Engineering

Here are the slides for my recent presentation at RECON, entitled "Automation Techniques in C++ Reverse Engineering". As usual, my slides use in-frame animations, so in brief, navigate them using contiguous mode (one slide at a time, advance/retreat with left/right) instead of continuous mode (where parts of multiple slides are visible at the same time, scrolling with up and down). A video of the talk was recorded, but RECON has not yet released it; I will update this post when the video is available, and likely tweet about it also.

(By the way, it’s become obvious in conversation that seemingly nobody reads the slides for my conference presentations, whereas more people do actually read my blog posts. Somebody suggested that this might be because conference slides in computer security are frequently thin in content and difficult to follow without an accompanying video, so people don't bother reading slides at all. I agree and I often don't read slides myself for the same reason. However, this is unfortunate, as I put a lot of effort into creating diagrams and animations for my presentations; I try to make them self-contained publications for which a video and/or accompanying white paper is not required. So if you were inclined not to read the slides on the expectation they'd be hard to follow standalone, I'd suggest giving them a look.)

In summary, I noticed that when I reverse engineer C++ programs, I spend almost all of my time recreating structures, applying structure offsets in the disassembly listing, and applying structure types to Hex-Rays variables and function arguments. I focused on automating these activities. I devised two techniques based on DLL injection for collecting structure-related data from programs at runtime. The first, inspired by academic work such as Howard, collects information about accesses to allocated memory. The other technique determines when dynamically-allocated objects are passed as arguments to functions. To process the data generated by these tools, I wrote an IDA/Hex-Rays plugin to automatically reconstruct structures from the data, automatically apply structure offsets, and automatically set types for function arguments and Hex-Rays variables. There are a number of interactive features that attempt to make reverse engineer's lives easier when dealing with structure recovery.

About the code, the short version is that it isn't ready for release yet. I did put a few days worth of effort into commenting it and cleaning it up, but it needs more than that. Furthermore, I confess that I quickly found myself distracted by new research directions and implementing new features, which I found a lot more interesting than, for example, thwarting ridicule by writing proper text parsers for the input formats rather than calling eval() on untrusted input. I want people to actually be able to use the tool when it's released, whereas in its present state, I'm probably the only person who could use it. Since you only get one chance at a first impression, I think it's more important to "release something useful" than to merely "release something for the sake of releasing something", and so the release will be come at a later date, when it's ready.

I have added some new features since presenting at RECON (which, likely, won't make sense unless you have read the presentation). First, I created an analysis that uses the Hex-Rays decompiler machinery to locate additional structure accesses that were not observed at runtime. Beyond that, most of what I've been working on lately is whole-program-scale recovery of every observed structure. The presentation touched on a few reasons why this is difficult (nested structures being one of them). The problem is more difficult than simply recovering a unique structure with unique substructures for every allocation site. In brief, to exploit the data to its fullest extent, one needs to determine one single type for every access location in the program -- even if it that location is observed accessing different allocations, or different locations within the same allocation. This necessitates discovering when two allocation sites allocate identical structures, determining identical substructure types contained within different structures, and determining nesting/inheritance relationships -- all the while battling with the noise in the data (as described in the presentation), having to explicate information only present implicitly, and contending with a very large state space that daunts direct computation of the optimal solution. Progress is good and tantalizing, but it isn't finished yet.

An Abstract Interpretation-Based Deobfuscation Plugin for Ghidra

This blog entry announces the release of an abstract interpretation-based Ghidra plugin for deobfuscation. The code can be found here (see the ‘Releases’ tab for a binary release). In view of the picture below, the static analysis described herein is designed to take graphs like the one on the left, detect and remove the "opaque predicates" (fake "conditional" branches that only go in one direction), and produce graphs like the one on the right.

HeaderImg.png

Though I have previously published the details of the analysis -- once as a blog post in 2011, once as part of my keynote speech at RECON 2012, entitled "The Case For Semantics-Based Methods in Reverse Engineering" -- the code that I had released at the time was for educational purposes only. It relied upon my private program analysis framework, which was never made public. The current release is fully-functional: you can use it immediately upon installation as an extension in Ghidra. The release ships with a number of examples, which shall be detailed in the rest of this entry. The reader is encouraged to reproduce the results for themselves using the provided scripts and binaries. The code is mostly meant to feed information into larger automated deobfuscation tools, but I have put a good deal of effort into creating user-interactivity and reusable code. I welcome feedback and pull requests for improving my understanding of Ghidra, and also Java development.

Although I prefer my blog entries to be self-contained, given that I've published the details of the analysis already, I don't want to reproduce those details in full. Thus, I shall only sketch the analysis in this entry, and refer the reader to the two links in the previous paragraph should they wish to learn more. (And if you would like to know more about abstract interpretation in general, I published a lengthy introduction to the subject.)

Motivation: Example #1

This example is the obfuscation scenario that lead me to develop this analysis in the first place. Consider the following x86 code, and the annotations off to the right which I created manually:

ObfTFAnnotated.png

Through a contorted process, this code pushes the flags onto the stack, and isolates the "TF" bit, also known as the "trap flag", which is set when single-stepping in a debugger. Using a few bitwise operators (AND, OR, and rotations), the code moves the TF bit into the position that the "ZF" bit (the "zero flag") normally occupies, and then loads the flags register with this modified value. Finally, it performs a "JZ" instruction. Since the TF bit has been moved into the ZF position, the JZ is actually testing whether the trap flag had been previously set. If so, the obfuscator corrupts the internal state of the program, leading to a crash later on. This is an anti-debugging mechanism.

The comments to the right demonstrate how I ultimately convinced myself that this was the behavior of the snippet. In essence, we follow the TF bit through the data flow of the code, and ultimately observe that the TF bit governs whether the JZ at the end of the block is taken. We do not know the values of any of the bits labeled "?", but as you can see, we don't need to. Importantly, as with the two AND instructions, we can sometimes determine the values of bits within quantities, even if some of the relevant input bits were unknown to begin with (e.g., notice all the 0 bits produced by the first AND operation above, despite one of the inputs containing 31 "?" bits).

These observations lead me to consider a generic, automated static analysis tool based on the type of analysis just pictured and described. I.e., if I can perform this analysis manually, why can't I write a program to do it for me automatically?

Automating the Analysis

To accomplish that, we will need two ingredients. First, we need to be able to represent quantities within the program (such as the EDX register and the [ESP] memory location) as collections of bits, with the added possibility that we don't know the values of certain bits (namely, the ones marked '?' above). That is to say, we will need to represent bits with three possibilities instead of the normal two: "0", meaning that the bit is known to be zero; "1", similarly with one; and "?" (also written "1/2" in the below), meaning that the bit is unknown. We will call these "three-valued" bits. Furthermore, we will need data structures grouping together fixed-sized collections of three-valued bits, as well as a model of memory containing such quantities.

The second piece that we'll need is the ability to represent the ordinary bitvector operations (such as AND, OR, the rotation operators above, ADD, MUL, IDIV, etc.) for three-valued bits, and do so faithfully with regards to the ordinary two-valued results. That is to say, when the bits are known to be constant, our three-valued operators must behave identically to the two-valued ones. For unknown input bits, the outputs must faithfully capture the results for both possible input values. To illustrate, let's consider the simple example of adapting the ordinary AND operator to the three-valued world. First, recall the ordinary truth table for two-valued AND:

3VLAnd2.png

How should AND behave in the presence of unknown bits? That is, what is the value of "0 AND 1/2", "1 AND 1/2", and "1/2 AND 1/2"?

  • "0 AND 1/2" is easy -- AND only returns 1 if both inputs were 1, so "0 AND 1/2" must be 0.

  • The "1 AND 1/2" case isn't as nice. Since the "1/2" could represent either 0 or 1, the operation could be either "1 AND 0" (namely, 0) or "1 AND 1" (namely, 1), so we have to say that the result is unknown -- that is to say, "1 AND 1/2" must yield "1/2".

  • For the same reason, "1/2 AND 1/2" yields "1/2".

3VLAnd3.png

As such, the truth table for our three-valued AND is as above. Note that the black values in the corners correspond to the cases when both input bits are known, and that furthermore, they match the two-valued truth table.

In the world of abstract interpretation, an analysis is said to be "correct" if it encompasses all legal data values that may actually occur at runtime. (All abstract interpretation-based analyses are designed to be "correct" by construction.) Since "1/2" refers to any possibility for a given bit, it is always correct for an analysis to decide that a particular output bit is "1/2". Therefore, the red values in the table above could all have been "1/2" (in fact, the black ones could have been "1/2" as well). However, another property of a correct analysis is its "precision". Though harder to quantify, one correct analysis is "more precise" than another if it models fewer data values. Therefore, producing "0" for the "0 AND 1/2" case is both correct (by the analysis above) and more precise than if we'd modeled that case by producing "1/2". Note further in looking at the annotated x86 code above that our choice of modeling 0 AND 1/2 as 0 was crucial in our ability to link the behavior of the JZ instruction at the end to the TF bit at the beginning. Had we modeled 0 AND 1/2 as 1/2 instead, the analysis would have failed to establish that connection.

Similar results may be derived for the other standard bitwise operations:

3VL-LargerTable.png

The OR case works out similarly to the AND case; if an input bit is known to be one, we can use "1" for the output, even if the other bit is unknown. NOT also works out nicely with little imprecision. XOR and == are not so nice; any time an input bit is unknown, the output bit is also unknown.

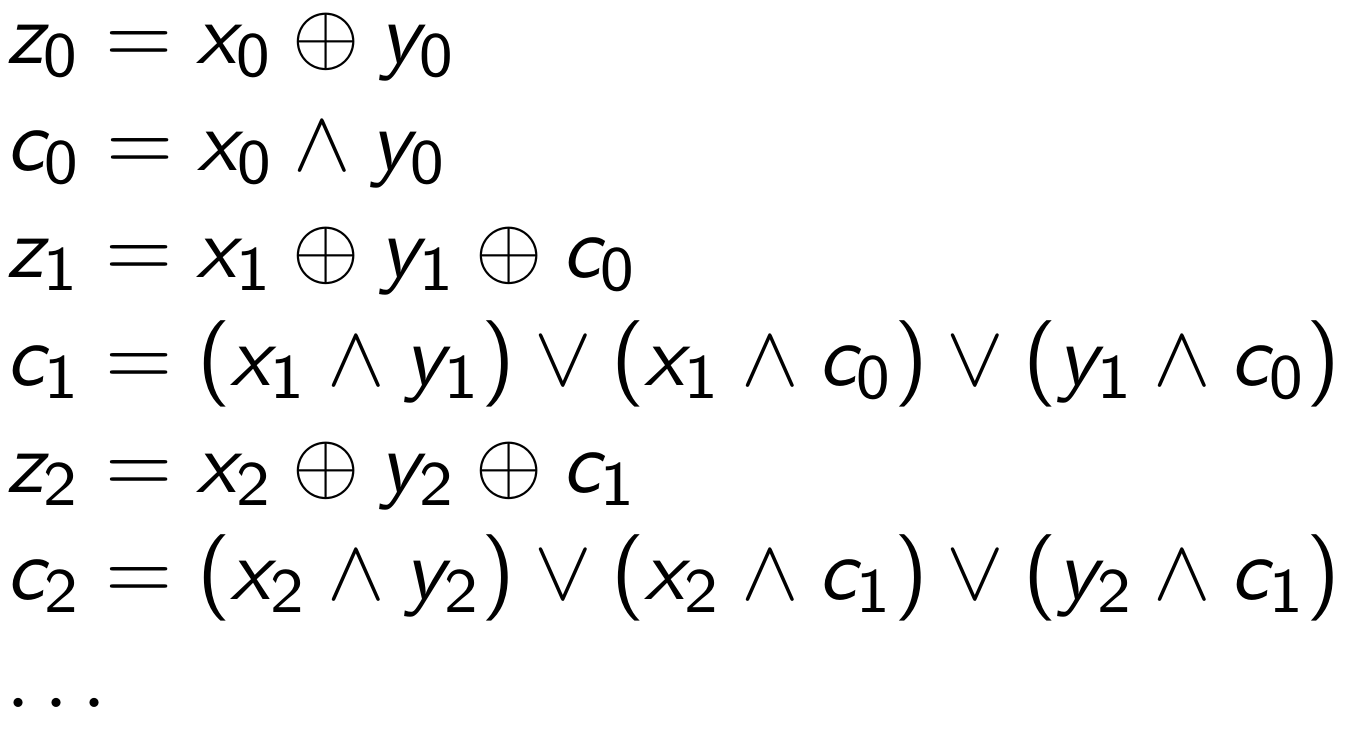
It may be less obvious how to deal with more complicated operations such as addition. The trick lies in realizing that there must be bitwise formulae for computing this operation (since, after all, processors implement these calculations), and we can just use the operators defined above to implement their three-valued counterparts. For example, addition of two quantities "z = x + y" is defined bit-by-bit by the following formulae, where the "c" bits are the carry bits produced at each step in the computation.

3VL-Add2.png

Since we have defined XOR, AND, and OR above, we can simply use the three-valued operators to implement three-valued addition.

3VL-Add3.png

The rest of the ordinary bitvector operations -- such as comparisons, shifts (including by unknown amounts), multiplication, and unsigned/signed division and remainder -- can be derived in a similar fashion. If you would like to see more derivations, consult the presentation mentioned previously, and/or read the source code.

Given that the example above writes to (and reads from) the stack, our analysis must also handle memory accesses. We use a crude model wherein only fully-known memory addresses are tracked. Any writes to addresses that are not fully known result in the entire memory state being set to 1/2 (since a write to an unknown destination could overwrite anything). This model is cruder than necessary, and it causes a few complications.

Implementing the Analysis in Ghidra

Since I had previously implemented the analysis for my private framework, my immediate task was simply to port it to Java, and more specifically adapt it to Ghidra's pcode (whereas my prior implementation had targeted my own intermediate representation). First, I needed to familiarize myself with Ghidra pcode. You can enable its display from the Ghidra user interface. After clicking the "Jenga" block in the top-right of the "listing window", right click on "PCode" and select "Enable Field", as below:

GhidraX86EnablePcodeProcedure.png

Now the listing will display the pcode translations for the assembly instructions:

GhidraX86PcodeEnabled.png

From here, you can start to get a sense of the pcode language. The Ghidra distribution ships with complete documentation of the pcode language; you can find it in your installation directory under "./docs/languages/index.html".

The initial port was straightforward and took a single day. Noteworthy components of that functionality are:

  • TVLBitVector.java: implements a class for aggregating fixed numbers of three-valued bits.

  • TVLBitVectorUtil.java: implements the three-valued version of all supported integer operators, such as AND, addition, etc.

  • TVLAbstractMemory.java: implements the memory model, associating addresses with TVLBitVector objects.

  • TVLAbstractGhidraState.java: models the entire state of a Ghidra pcode program: register values, "unique" values, and memory spaces.

  • TVLAbstractInterpreter.java: the core of the abstract analysis. Given Ghidra pcode objects, query the TVLAbstractGhidraState to obtain the TVLBitVector representations of the inputs, decide which pcode operation is taking place, invoke the relevant method in TVLBitVectorUtil to perform the abstract operation, and finally update the TVLAbstractGhidraState with the result.

Example #1, Continued

From the analysis above, we expect that the JZ instruction at the end will be taken, or not taken, depending respectively upon whether the initial value of the TF register is 1 or 0. We can use the abstract interpretation-based analysis described above to investigate.

First, within a new or existing Ghidra project, import the binary "3vl-test.bin" (which ships with the code I've released, under the "data" directory in the root).

GhidraImportMenu.png

Next, when the "Import" dialog pops up, select "x86 / default / 32-bit / little-endian / Visual Studio" from the "Language" listing:

Ghidra3VLSelectLanguage.png

Upon loading the binary, Ghidra will ask if you wish to analyze the binary, as in the figure below. This is optional -- the analysis will work even with no code defined in the database -- but you might as well press 'Yes' to make it easier to interpret the results.

GhidraAutoAnalyze.png

Finally, bring up "Window->Script Manager" and select the folder "Deobfuscation", then double-click the script "Example1TF.java". It's a good idea to read the script to get a sense of how you should invoke the relevant library code. The script analyzes the code in the range of addresses 0x0 to 0x1C. It performs three separate analyses: one when the TF bit is initially set to 0, one where the TF bit is set to 1, and another where the TF bit is not set (i.e., is considered unknown, or 1/2, initially).

The output is not very sexy, but it does confirm that the analysis was able to discover the relationship between the initial value of the TF bit and the ultimate decision as to whether the JZ instruction was taken.

Ghidra3VLScriptOutput.png

The later examples will demonstrate more capabilities of the analysis, and more options for visualizing the analysis results.

Example #2: An Obfuscating Compiler on ARM

Last year I found myself looking at an ARM binary produced by an obfuscating compiler. I realized that I could break certain aspects of it with the same techniques as described above. However, my binary program analysis framework did not support ARM. Thus, in order to make progress with the obfuscated binary, I needed to first add ARM support to my framework -- a task that I realistically expected would take weeks or months, based on my experience writing the x86 support. Rather than adding ARM support, I remorsefully abandoned the project instead. Now that I have ported the analysis to Ghidra, and because Ghidra supports pcode translation on ARM, my code just works, automatically. Those weeks or months of agonizing tedium have been shaved off of my research budget.

Here's a snippet of the obfuscated ARM code:

ARMObfAnnotated.png

The comments off to the side indicate the values of the registers and memory locations as the code executes. Basically, through a convoluted series of arithmetic operations, R0 ultimately obtains the value 0x8E8C, which is then moved into the program counter (PC register) on the final line. All of this code is effectively just a branch to loc_8E8C. However, due to the obfuscated implementation, most disassembler tools won't be able to determine the branch destination, and hence will simply stop disassembling after the line ending in -88. The Hex-Rays decompiler can successfully resolve this branch, but chokes on the next one:

ARMHRFailure.png

(In fairness to Hex-Rays, if the user manually adds a cross-reference from the final instruction to the resolved destination, it will be able to proceed with decompiling the code at the target address. The analysis described herein can furnish such branch targets.)

This is another form of obfuscation that can be handled by the analysis described by this entry. Similarly to the steps given previously, import the binary "ARM-LE-32-v8-Default.bin" into your Ghidra project. This time, for the "Language", select "ARM / v8 / 32-bit / little-endian / default", as in:

GhirdaImportARM.png

As before, upon loading, Ghidra will prompt you whether you would like to analyze the binary. Select 'Yes'. Next, under the Script Manager window, in the “Deobfuscation” directory, run "Example2ARM.java". By default, the script will add comments to the disassembly listing when it resolves conditional or indirect branches. In particular, running the script should add the comment shown in the figure below:

ARMAnalysisResolvedBranchComments.png

Let's also take a look at some other output options. For both this example and the previous one, I have shown assembly snippets with manually-written comments suggesting what the written values look like. In fact, given that the analysis automatically computes such information, we don't have to manually create comments like these. Towards the bottom of Example2ARM.java, you will see four calls to "runWithAnalysisOptions", where the first one is enabled and the final three are commented out. Uncomment the second one (the one with "ValueComments" in the code) and run the script again. After adjusting Ghidra's listing fields in the Jenga display (namely, enabling the "PCode" field, and dragging the "Post-Comments" field next to it), we get a nice listing showing the three-valued quantities derived by the analysis after every pcode operation, as such:

ARMAnalysisValuesOutput.png

Notice that many values have been determined to be fully constant. In fact, every pcode operation in this example either produces a value that is fully known (i.e., all constant bits), or fully unknown (i.e., all unknown bits). For example, take a look at the output for the pcode in the first instruction, which I've reproduced below for easier discussion:

ARMAnalysisValuesOutputCropped.png

The second pcode line computes whether the register "r0" is signed less-than 0, and stores the boolean result in a variable named "tmpNG". Since the value of r0 was determined to be 0, the result of this comparison is known: 0 is in fact not less than 0, so the value written to tmpNG is 0. Similarly, the subsequent line compares r0 against 0 for equality, and sets the variable "tmpZR" based on the result. Since r0 contains 0, tmpZR will always be 1 after this comparison.

In compiler theory, an analysis known as "constant propagation" determines when variables are known to contain constant values at a given point in the program, and replaces the variable with the constant. A related analysis, "constant folding", determines when all of the inputs to a given operator are constant values (such as the signed less-than operator, or equality comparison operator from the code just discussed), computes the constant result, and replaces the operation with its result. Our analysis performs both constant propagation and constant folding as a side-effect of its main goal. Also, the code optionally has the ability to modify the pcode along those same lines.

Modify the "Example2ARM.java" script again, this time uncommenting the third call to runWithAnalysisOptions (the one with "PcodeComments" in the code), and commenting out the others. Now, run the script. Below is an example of its output for the same truncated example above. I have manually indicated with red dots where the analysis has changed the pcode -- namely, the computations for "tmpNG" and "tmpZR" both become "COPY" operations, instead of their original "INT_SLESS" and "INT_EQUAL" operations.

ARMAnalysisPcodeOutputCropped.png

(The output may be a bit difficult to read -- it uses the so-called "raw" output for the pcode, which differs from the output that Ghidra uses by default.) For completeness, here are the analysis results for the entire sequence.

ARMAnalysisPcodeOutput.png

Example #3: Virtualization Obfuscation

The previous two examples were mostly for proof of concept. We isolated two representative examples of the opaque predicates generated by the respective obfuscators, and demonstrated that the analysis is capable of resolving the correct branch destinations. Though both examples came from real-world scenarios, they were curated for the sake of demonstrating the analysis. For this example, we will use a real-world sample, unmodified, in its natural habitat.

The sample in question is a purportedly malicious binary, obtained from VirusTotal, which is protected by a virtualization obfuscator. (I haven't analyzed the sample and can't speak about its malicious activities.) Rather than examining sample snippets as in the previous two examples, we shall compute an analysis across entire control flow graphs, taking branches into account. The control flow graph-based analysis is computed very much in the same style as so-called "global intraprocedural dataflow analyses" from compiler theory.
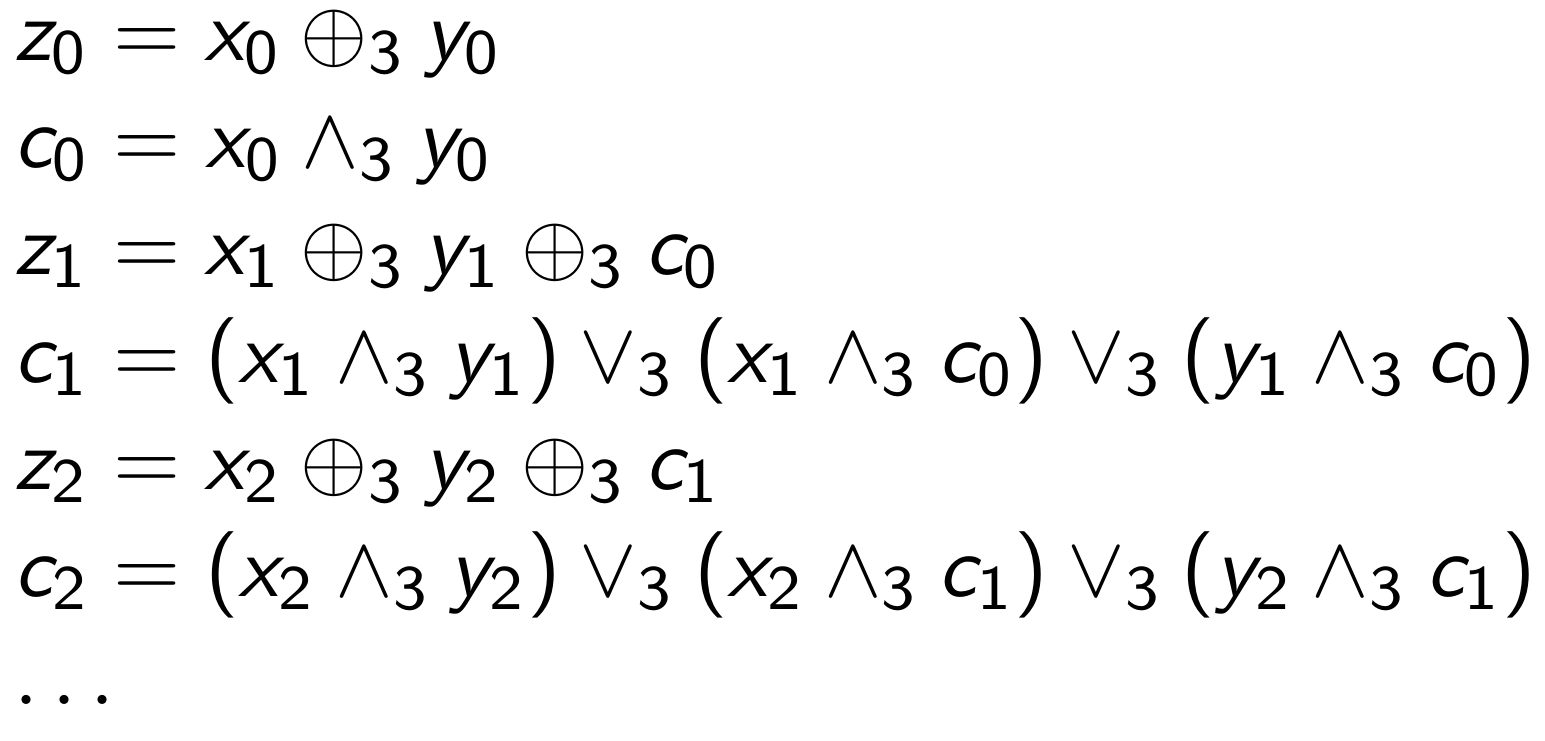
The sample can be found in the same directory as the previous examples. It is contained in a .ZIP file with the password “infected”. Extract this archive to a location that won’t be intercepted by your anti-virus software.

The VM uses a similar type of obfuscation as we've already seen -- fake branches based upon constant values -- though the implementation is distinct from the previous examples. Here's a representative example of one of its opaque predicates:

VMIDAOpaque.png

The middle basic block begins by setting CH to 55h. Next, the code subtracts 0Ch from CH. After an unimportant unconditional branch, it then performs a "JO" conditional branch, which is taken if the OF flag had been set by the subtraction. Since the values just described are all constants, the branch has to evaluate the same way every time it executes -- it will either always be taken, or never be taken. (In fact, it can never be taken.)

The analysis library contains one final result visualization technique not described by the examples above. When the analysis determines that a branch always goes in one direction, as long as the code down the not-taken path is not referenced elsewhere, we can color the not-taken instructions in red. Then, in concert with Ghidra's "Window->Function Graph" visualizer, we can easily visualize which parts of the code were not executed. In the figure below, the blue nodes were executed, but the red nodes were not. You can reproduce this for yourself by running the Example3VM.java script.

VMGhidraGraphColored.png

Problem: Parity Flag

At this point in the blog entry, it should not be surprising that we can detect these opaque predicates and remove them. I did run into one snag trying to use Ghidra on this sample. Namely, some of the opaque predicates are based on the x86 parity flag:

VMPF.png

However, by default, Ghidra's x86 language model does not model the updates to this flag. That is to say, even if an x86 instruction modifies the parity flag, Ghidra's pcode translations do not include updates to this register. For example, both the AND and OR instructions in the snippet below do in fact set the parity flag when executed on an x86 processor. However, as you can see, the pcode does not contain updates to the parity flag.

VMPFNoModel.png

Although this is a sensible design choice for many binary program analyses, we find ourselves in need of such information. For most binary analysis tools, we would find ourselves somewhere between screwed with no way to proceed at one extreme, or facing a non-trivial development effort to model the parity flag at the other. With Ghidra, I managed to solve the issue within about a half an hour. More specifically, under the Ghidra installation, the file ./Ghidra/Processors/x86/data/languages/ia.sinc contains the following snippet:

ExistingIaSinc.png

I was able to simply insert code to properly model the parity flag (the diff is here). After reloading the binary, now the pcode contains proper updates to the parity flags:

VMPFModel.png

I was very impressed at how easy it was to enable this change. Between that and the fact that my analysis worked out of the box on ARM, Ghidra has proven itself to be very capable in the binary program analysis department, not a curiosity or a toy.

Control Flow Graphs

The virtualization obfuscator employed by this binary obfuscates the VM instruction handlers with opaque predicates as demonstrated above. Most unobfuscated handlers, in reality, consist of a single basic block with no control flow. However, a few of the handlers do contain legitimate control flow, including one with a loop. We would like to remove bogus control flow, while at the same time respecting the legitimate control flow.

Rather than hacking together a proof of concept that would only serve as a demonstration, I decided to solve this problem the proper way. In particular, I implemented a library for representing and creating control flow graphs, which is configurable in a variety of ways. Then, I implemented the classical compiler algorithm for solving forward data flow analysis instances. (At present, this code is specialized for the analysis described hereinbefore, but I will likely generalize it to support arbitrary forward and backward data flow problems on pcode control flow graphs). This involved a non-trivial development effort that accounts for over 30% of the code at present.

A False Negative

As one final curiosity, I'll present an example where the analysis was not sophisticated enough to resolve one particular opaque predicate. Take a look at the graph below.

VMGhidraFalseNegative.png

The first assembly language instruction in the first block actually expands into a loop in the pcode control flow graph, which results in complete loss of information about the memory contents. The second, red-underlined line adds a value from memory to the ESP register. Given that the memory state is unknown at this point, the value being added to ESP is unknown, hence the entire register ESP is unknown. Therefore, the subsequent instructions that access the stack are doing so at unknown addresses, so we can't model their effects precisely. As a result, although the third basic block implements a typical opaque predicate that we would ordinarily be able to resolve, because it involves the stack, our analysis cannot resolve it.

So be it. Actually, this is the only opaque predicate in the whole binary that the analysis is unable to resolve.

Conclusion

This blog entry served to announce the release of an open-source deobfuscation plugin for Ghidra. In actuality, this is part of a larger effort, unimaginatively termed "GhidraPAL", short for Ghidra Program Analysis Library. Of the four packages in the distribution at present, three of them are generic and are not tied to the analysis described in this entry. I plan to implement more standard functionality in the future (such as integration with SMT solvers), as well as any other analysis I find useful in binary analysis, and of course weird research efforts that may or may not be useful.

I still have one more thing to tackle before I feel comfortable recommending Ghidra wholeheartedly for automated binary program analysis. If it turns out that, as usual, I am just being neurotic and anticipating problems that will in fact not materialize, then I'll give it my fullest blessing. For now, my experience with this project was almost entirely painless. Ghidra's API is, on the whole, absurdly well-documented. At times I found myself griping that I couldn't find things because there was too much documentation. (Imagine that as a complaint about a software system.) Beyond the documentation, it's also sensibly designed, and includes a lot of very useful functionality in the standard distribution. For classical data flow analysis and abstract interpretation, I highly recommend it, though the jury is still out on SMT integration.